

Excess mortality for 25 to 44 year-olds continues

Effects that began with COVID-19 continue to cause the largest relative excess mortality (+42%) in the age group of 25 to 44 year-olds in the USA. Reasons are unclear, but some states performed far better, some have improved, and some have rising mortality. Policy differences may explain the graphs below1, where I comment on patterns in the mortality charts. My goal in writing this up is to draw attention to the issue and gain insight. Why is there so little public discussion of the huge number of seemingly avoidable deaths?
1. USA overall
During the COVID-19 era, mortality for 25 to 44 year-olds has been 42% above normal (151,909 additional deaths). Every rising pixel on this graph represents an enormous human toll of untimely passing. Seasonal peaks contribute only weakly, unlike for the elderly (second graph), indicating that the pandemic played an indirect role in the younger group.


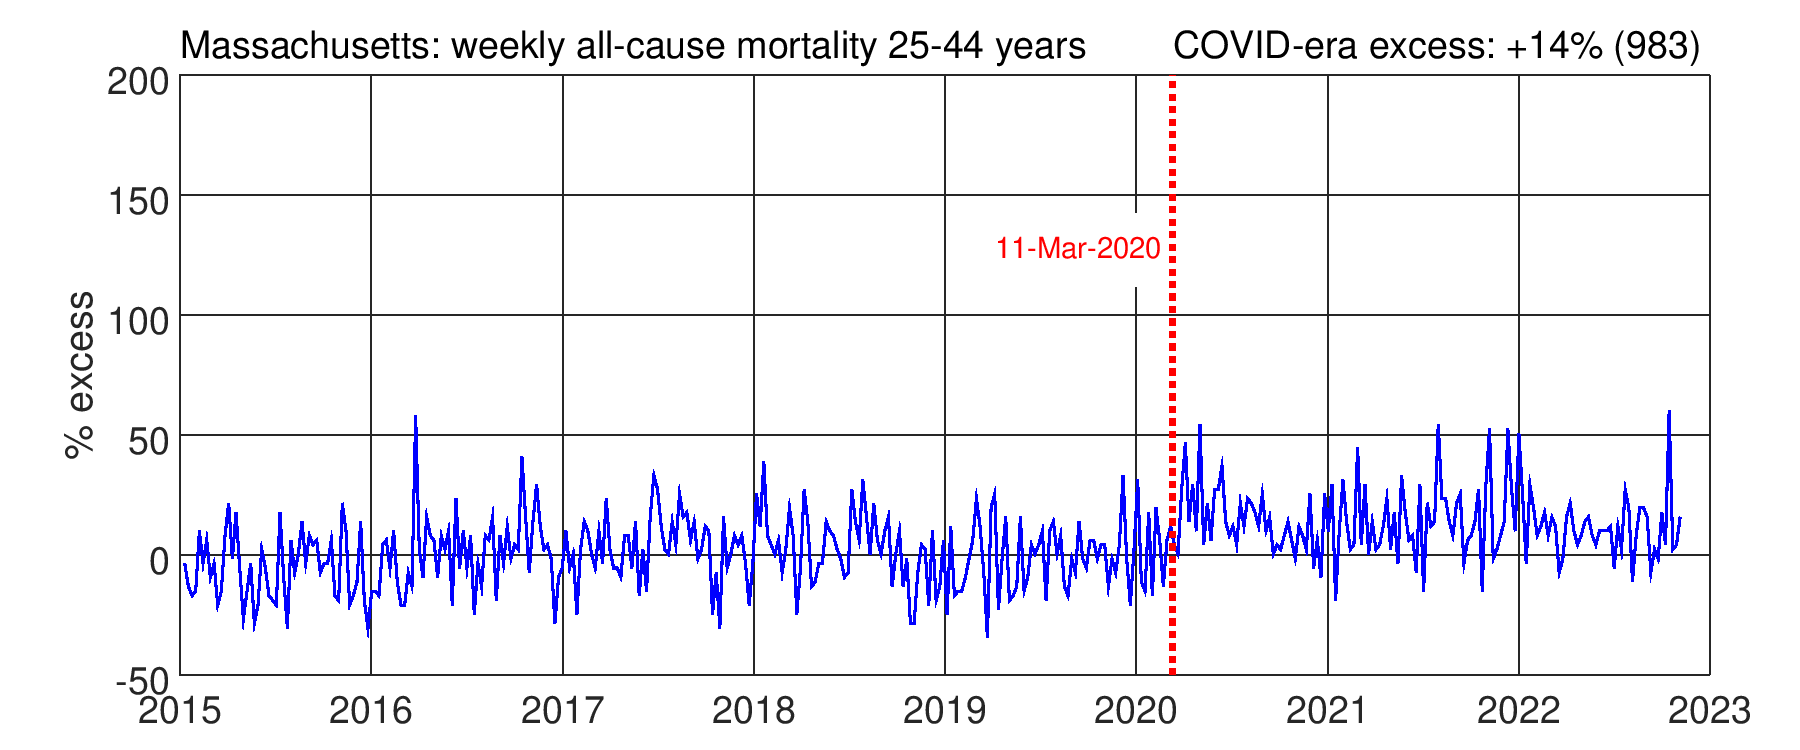
2. Puerto Rico, Massachusetts
PR and MA have the lowest excess in this age group (12% and 14%), about three times lower than the national average. What is their secret? The large geographic separation indicates that regional epidemiology is not the determining factor. These two places show that comparatively low excess was possible. Perhaps the hospital system in MA is better than others, while PR benefits somehow from being an island. Hawaii, the other island chain, lacks data in the 25 to 44 age group (see section 9), but has very low excess for 45-64 year-olds.

3. Pennsylvania, Ohio, Illinois
PA (+19%), OH (+25%), and IL (+34%) noticeably reduced their excess mortality during the first quarter of 2022. What changed? The age group never experienced large peaks, but rather a nearly-two-year long elevated baseline. Michigan (+30%) and Maryland (+27%) are similar.


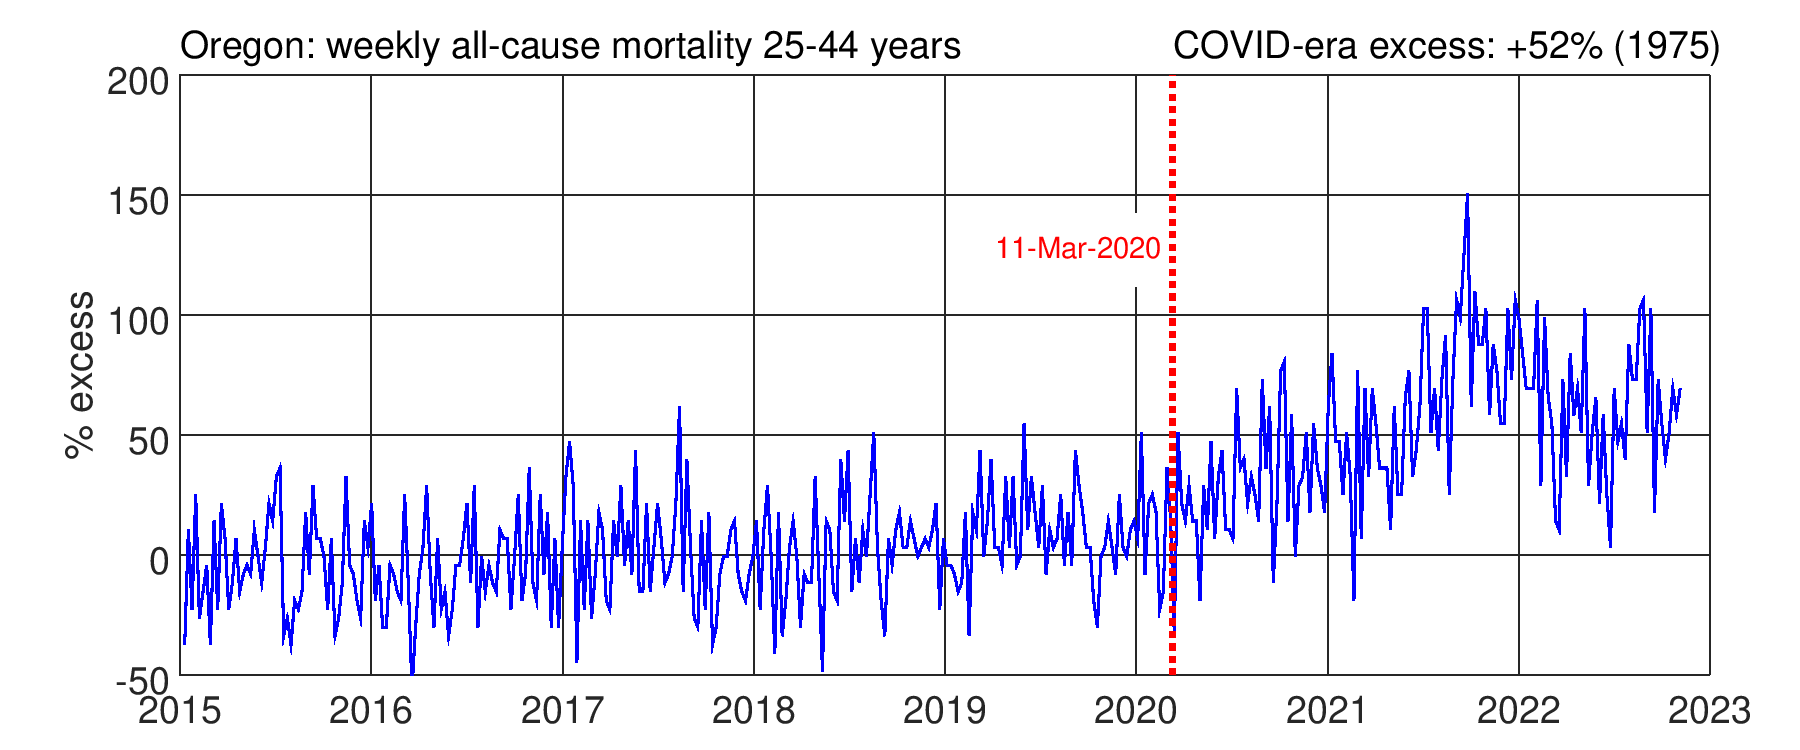
4. Oregon, Washington
OR (+52%) and WA (+48%) had initially lower excess during 2020, which then rose significantly and remains elevated near +50%.

5. Florida, Georgia, Texas, etc.
The most common pattern is an elevated baseline (about +40%) with a prominent peak above +100% in Summer/Fall, 2021. Many other southern states are like this (AL, AR, KY, LA, MS, NV, NC, OK, SC, TN). The peak is often attributed to the “Delta wave” in unvaccinated people. However, this seems questionable because Ohio (see section 3) mostly avoided the peak despite modest vaccination rate. In any case, total deaths from the elevated baseline are far more than from the sharp peak (area under curve).


6. California
CA has multiple peaks with the largest in January, 2021, as well as a high elevated baseline. The total is +56%.

7. New Jersey, New York City
NJ and NYC had peaks above 150% in Spring, 2020 and have since stabilized at an elevated level, with some improvement in early 2022.


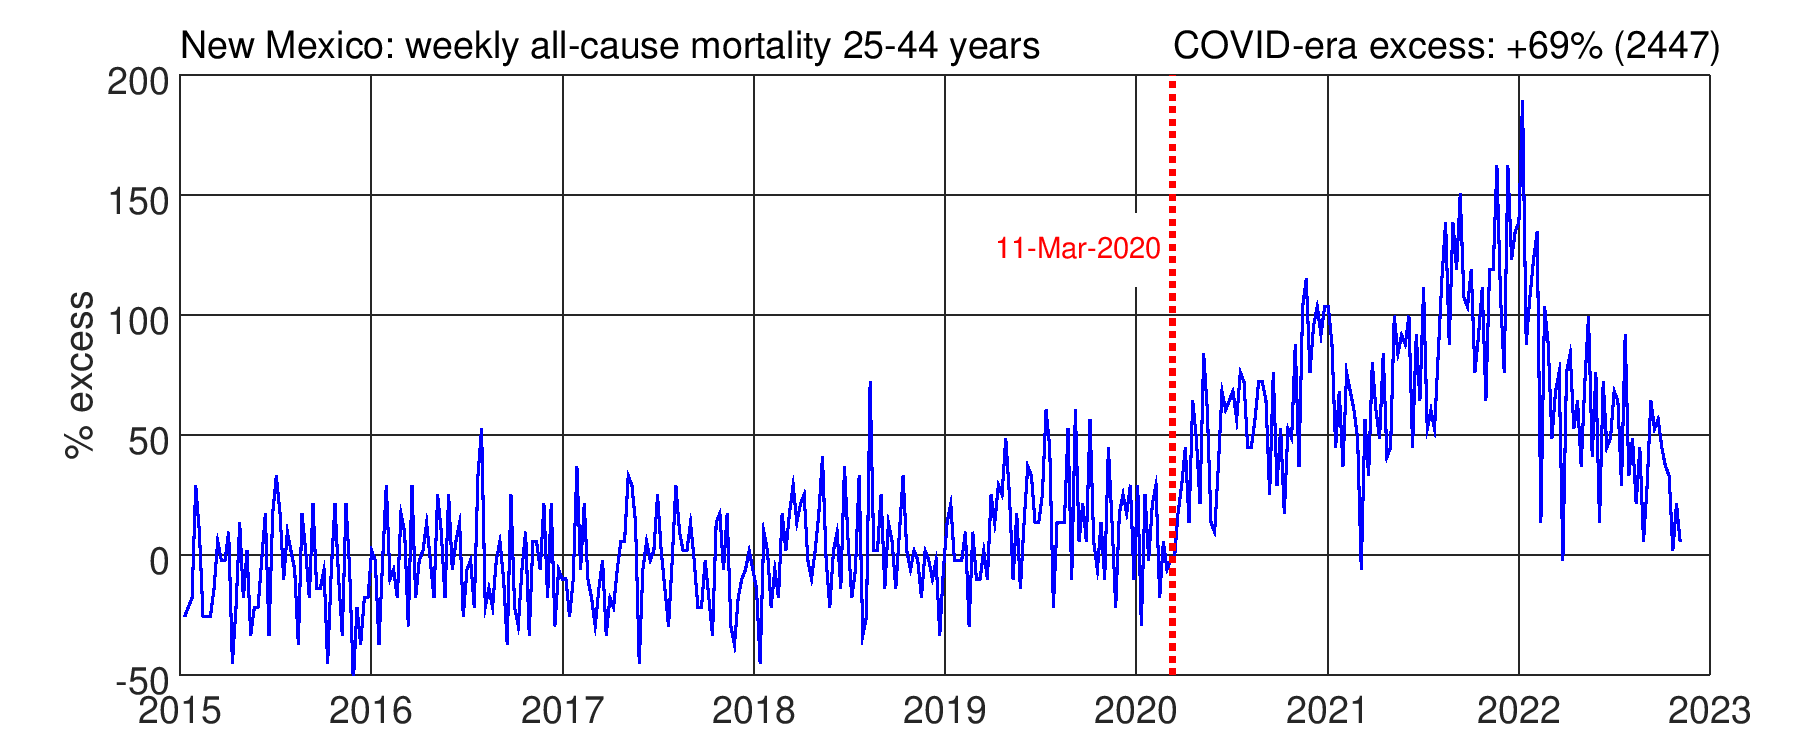
8. New Mexico and Arizona
NM (+69%) and AZ (+68%) have the largest excess among states with valid data

9. Less-populated states
The CDC explains: Data for jurisdictions where [weekly] counts are [below 11] are suppressed.
This prevents analysis of the 25 to 44 age group in low-population states (DE, HI, RI, ID, ME, MT, AK, SD, ND, WY, VT) and the District of Columbia, because most weeks of data are suppressed. A modest rise causes many weeks to be above the reporting threshold, unpredictably multiplying the total increase.
Conclusion
Patterns and levels of CDC reported excess deaths for the 25 to 44 age group differ widely among US States/Territories with an average of +42% in the COVID-19 era, unchanged from last year. Puerto Rico and MA exhibit far lower values (about 13%), despite having nearly opposite geographic, economic, and demographic character.
The “Delta wave” coincided with a mortality peak in most southern states but contributed only a small fraction of the COVID-era total. Reasons for mortality during the wave remain unclear.
Vaccines, introduced in 2021, did not cause clear changes to the mortality trajectories. Neither negative, nor positive effects are apparent.
The most prominent feature is a high, elevated, baseline. However, COVID-19 is seasonal, so the virus seems to not be the direct cause. The mortality graphs probably reflect changes in the availability, use, and quality of health care, as well as broader social changes. Data from Puerto Rico and Massachusetts indicate that most of the nearly 152,000 excess deaths among 25 to 44 year-olds were avoidable.
Please keep comments on topic.
All data was extracted from the CDC file Weekly Deaths by State and Age, downloaded 1/9/2023, available here. The ongoing COVID-era is defined as the period from March 11, 2020 through November 10, 2022 (when reliable data ends). Excess is defined as the weekly mortality increase compared to the average value in the reference period 1/1/2015 through 12/31/2019.
Have you looked into lifespan expectations in MA and PR? I seem to recall they were both above the US norm. My first suspicion would be diet.
Thanks for this. I'm researching the hypothesis this virus was spreading widely months before the lockdowns. If my theory is true, I think there would be some increase in "all cause" mortality especially in the 75 and over demos in, say, December 2019 through early March 2020. I saved data from the first 13 weeks of 2020 in Michigan which seems to show a pretty noticeable spike in deaths compared to the previous five-year norms. I've had problems finding simple "mortality" numbers (by year and week) for many states. Do you happen to have that info? Can you test or look at data from various states and see if deaths were up in December 2019 through about March 1 2020 in any states? I don't think it would be a huge spike, but still noticeable.
I took particular interest in your first graph which shows all-cause mortality for America age 75 to 84. To me, it looks like there is a noticeable increase beginning in late 2019 and going to March (before Covid). Do you agree? I don't see the same bump in other years (except 2018 which was a real bad flu year).
My hypothesis is that some "early" Covid deaths were probably "missed" or attributed to other causes, especially in the 75 and older age cohorts.
Thanks for any help you can provide!
bill rice jr.
My email is:
wjricejunior@gmail.com